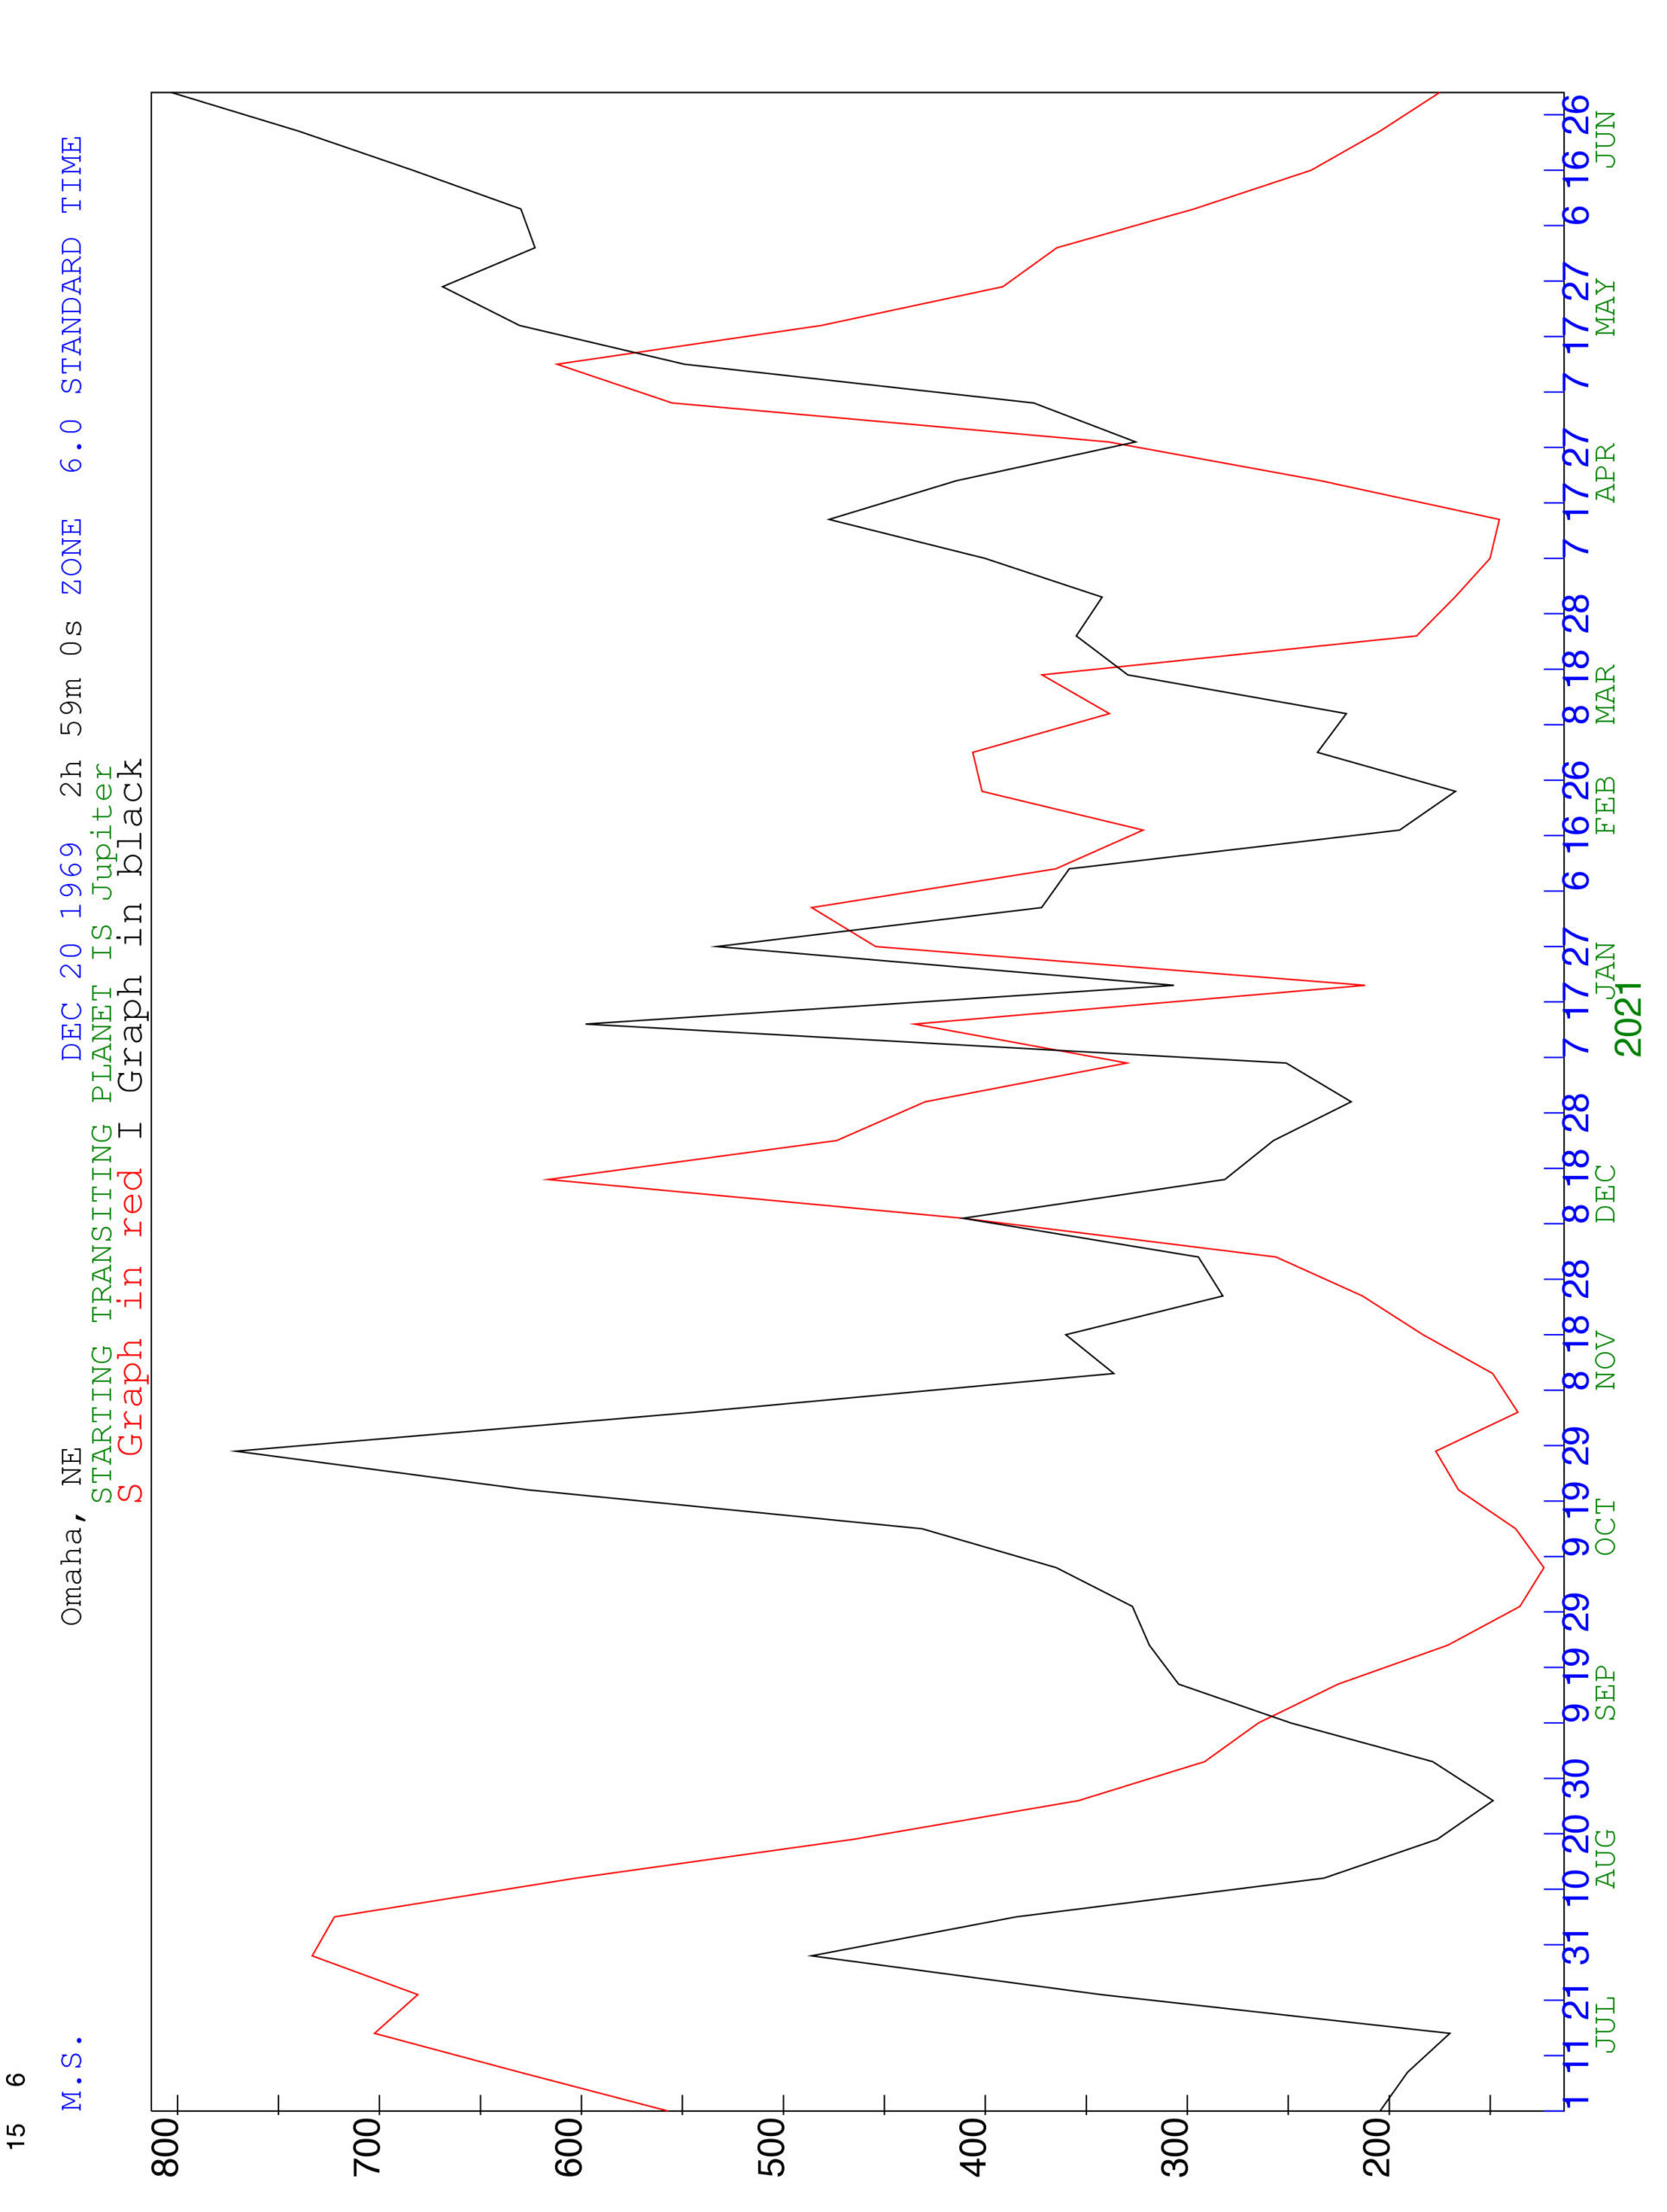
Mostly used for Stock Market studies, the Dynamic Astrograph plots the motion of a planet (usually Jupiter) on a graph chart, showing the high and low points of the annual period. A Jupiter Astrograph with a high point is supposed to be a good time for investment.


